A Data-Driven Look at the Invisible Work of Developers
The metrics described here are signals, not scores. Use them to support conversations, not replace them.
The Myth of Developer Productivity
I’ve worked as a software development lead in one form or another since 2000. For 25 years, I’ve watched managers wrestle with how to objectively measure a developer’s productivity. More often than not, the question gets sidestepped entirely—left to “gut feel,” 1:1 conversations, or the occasional peer review. Most of the time, it’s simply ignored unless a problem becomes too big to overlook.
I’ve lost count of how many times I’ve heard a leader insist that “working in the office is more productive,” or that we’ve “lost the value of watercooler conversations”—always with confidence, and almost never with data.
Are developers more productive on-site than remote? It’s a fair question. But how can we answer it if we don’t even try to measure developer productivity?
Occasionally, leadership tries to tackle the issue head-on. These efforts are often led by people even further removed from the day-to-day work of development. Don’t take my word for it—just Google “common developer productivity metrics” and you’ll find a familiar list:
Mean Time to Recovery
Mean Time to Resolution
Sprint Velocity
Lines of Code (LoC)
KLoC (Thousands of Lines of Code)
…
Many of these metrics have their place—in measuring team performance or business responsiveness. For example, “Mean Time to Recovery” which tracks how long it takes to restore service after an incident, can offer insight into system resilience but as a tool for assessing individual developer productivity? These metrics quickly fall apart.
Why? Because they often reflect business processes more than developer effort. “Release Frequency” is another example. A dev may be writing and committing code daily, but release schedules are often dictated by product management, SaaS release schedules or compliance timelines. Similarly, “Customer-Reported Defects” might hint at quality issues, but in large teams or legacy systems, tracing blame to a single developer is unrealistic—and usually unhelpful.
And don’t even get me started on Sprint Velocity. Story points are flawed in so many ways that they may be Agile development’s greatest misstep when misused for performance tracking.
To be fair, a few of these common metrics do flirt with usefulness. “Pull Request Size,” for instance, can begin to tell us something interesting about habits and working style.
So what should we be looking at?
If we’re serious about measuring individual developer productivity—ethically and effectively—we need to apply a different lens. Here’s what the right metrics have in common:
-
They isolate developer effort, not business decisions.
-
They reflect day-to-day developer activity.
-
They are objective, not based on opinion or gut feel.
-
They tell a meaningful story—or at least a useful chapter of it.
-
They align with the developer’s actual responsibilities. If part of their role is writing Jira tickets, then yes, track that—but track it meaningfully.
In my work, I’ve explored dozens of potential signals from Git and GitHub activity. Some were dead ends while others revealed unexpected insight.
What Your Revision Control System Can Tell You
Version control systems like Git, Perforce, Mercurial, or even legacy systems like SVN weren’t designed as analytics tools but they hold something incredibly valuable: a timeline of developer behavior.
Every commit is a breadcrumb—a snapshot of what changed, when, and (hopefully) why. When aggregated and interpreted carefully, this data can offer powerful insights into how developers work.
⚠️ Caution: Commit history is noisy. Especially in systems like Git, where history can be rewritten and where tooling, bots, and merge commits can muddy the waters. Before you can extract signal from it, you have to clean it (or understand how to filter it to get just the data you want).
Let’s walk through what kinds of insights are available—and where they can go wrong.
Commits: Small Clues in Large Numbers
Commit Frequency
Frequent commits might indicate high engagement, while long gaps might signal context switching, blockers, or focused work. But beware of misreading:
-
Some developers commit once per task.
-
Others commit after every logical change.
-
And some squash all commits before merge (losing history).
Before analyzing commit frequency, it’s important to establish a baseline expectation within your organization. For example, you might encourage developers to commit at least once per workday. If your team uses squashed commits or rebased branches as part of its workflow, those expectations of what are acceptable, or ‘good’ numbers may need to shift accordingly.
Without these shared norms, frequency metrics risk being misleading—or worse, punitive.
git log --no-merges --remotes --author="Jane Developer" --since="3 months ago" --pretty=format:"%h %ad" --date=short | wc -l
Might give you the raw count of commits for a given developer, but without context this number may be meaningless. What context can we add to resolve this metric to something more meaningful?
git log --no-merges --remotes --author="Jane Developer" --since="3 months ago" --shortstat
Will return additional information per-commit, such as lines added, lines removed and number of files changed. From here, you can start to consider:
- Average lines changed per commit
- Net change per week or month
- Adjusted averages, filtering out autogenerated code or bulk refactors
So with this example one metric has become four, and together they tell a much more compelling story about the size, frequency and possibly character of a developers commits. These reveal not just how much someone touches code, but how they work – small frequent improvements vs. large batch drops.
🛠️ Pro Tip
Use--no-mergeswithgit logto avoid double-counting in the commit history.
And--remotesto pull history from branches located in the remote that might not exist locally.
Commit Content: Telling the Story
Commit Messages
Commit messages should explain why a change was made—not just what changed. To assess this, I developed a Commit Message Quality Score, which combines readability, structure, and intent.
The scoring includes:
- ✅ Word count (minimum 5 words)
- ✅ Character count (minimum 20 characters)
- ✅ Readability (based on Gunning Fog Index and Coleman-Liau Index)
- ✅ Structure and clarity (e.g., presence of imperative keywords like
fix,add,remove, or references likeAESW-1234)
“Fix login bug” is acceptable.
“Fix login bug caused by unescaped input in SSO handler” is far better.
Readability indices aren’t perfect, but they provide signal—especially when averaged across commits. Combined with structure detection (e.g., recognizing messages that start with standard verbs or ticket references), we can begin to assess communication hygiene over time.
I found that:
- High-quality commit messages often correlate with better PR outcomes and fewer misunderstandings.
- Low-effort messages (“update”, “misc”, “test”) tend to cluster around hastily made changes—or worse, emergency fixes.
Commit messages are a developer’s first line of documentation. A quality score helps ensure that line is clear.
Authorship Issues
In real-world repos, you’ll often find the same developer committing under multiple names or emails.
“jdoe”, “j.doe@company.com”, and “123456+jdoe@users.noreply.github.com” might all be the same person.
To address this, I built a normalization layer that maps known aliases together. Without this step, your metrics risk double-counting or misattribution. This is something you can monitor for in your organization and set a standard to address. Just be sure to provide some documentation to your team on how to detect and address these issues.
🛠️ Pro Tip Implement Caching in your Metrics Automation
Git history queries and GitHub API calls can add up quickly. Caching normalized author data and repeated stats improves performance and helps you stay under rate limits.
What Revision Control Can’t Tell You
Not everything shows up in commit history:
- Time spent debugging, reading docs, or helping a teammate.
- Design work that leads to clean, elegant (and small) diffs.
- Performance optimizations with no visible code change.
Also, beware of misleading activity:
- Massive deletions can spike your “net change” metric, sending it into negative numbers.
- Tool-generated commits (like updated lockfiles or WSDL changes) distort volume-based stats.
- Authorship issues, especially over large spans of time, can skew your numbers.
- Including merge commits in your data can duplicate the results, skewing your numbers.
Putting It to Use
Once cleaned and filtered, revision control history can help you answer meaningful questions about how your developers work — not just how much they work. Below are examples of the kinds of questions you can ask, and the metrics that can help answer them:
Is this developer actively contributing?
Metrics to consider:
- Commit count (past 7/30 days): Raw activity measure
- Commit frequency: How often they push changes — helps distinguish between consistent and bursty contributors
- Time since last commit: A zero-line commit count may still indicate recent engagement
- Pull request participation rate: (from Github or equivalent) Number of PRs opened and reviewed
Do they break work into logical chunks?
Metrics to consider:
- Average commit size (lines/files changed): Smaller, more frequent commits suggest clean task separation
- Commit frequency: Regular commits are more likely to represent intentional milestones
- Ratio of small to large commits: Helps identify batching or infrequent drops of code
- Percent of commits with structured messages: Commits that include ticket references (
ABC-123,PROJ-456) often tie back to intentional work units - Ticket traceability (via Jira or equivalent): If commits consistently reference issues or stories with low-to-moderate story point estimates, it signals that developers are working in well-scoped, manageable chunks
Are they refactoring or mostly adding new code?
Metrics to consider:
- Net line impact (added – deleted): Frequent low or negative net change may indicate cleanup or refactoring
- Adjusted impact vs. raw impact: Removing large bulk additions (like vendored files) can reveal intentional structural changes
- Ratio of modification commits to additive commits: Especially when deletions exceed insertions
Optional (if parsing diffs):
- Frequency of renamed or moved files
- High-change commits that touch many files but add few lines
Are their habits changing over time?
This is where short-term snapshots give way to trend analysis:
- Time series of commit frequency: Spikes/dips can indicate PTO, burnout, onboarding, or changing project roles
- Moving average of commit size: Indicates whether someone is maturing into cleaner units of work
- Activity clustering: Bursts of activity followed by silence may indicate deadline-driven work or poor time allocation
🛠️ Pro Tip To measure these, you’ll need to store daily/weekly snapshots in a database or other medium. Visualizing them in charts (e.g., moving averages, sparklines) makes change easier to spot.
This gives you part of the story—just one lens, focused on raw effort and rhythm.
We’ve already teased using GitHub for some of these metrics, and the reality is this: to get a meaningful picture of developer productivity, we need to weave together data points from multiple sources.
Revision control is a natural starting point. But to understand the rest—the collaboration, the feedback loops, the review culture—we have to look elsewhere.
That’s where platforms like GitHub come in.
On Transparency and Trust
Developer metrics should never be hidden.
If you’re collecting data on how people work, they deserve to know what you’re measuring, how you’re interpreting it, and what you’re using it for.
On my teams, this is non-negotiable:
Every metric we gather is shared with the developers themselves.
Every analysis is open for discussion.
Every decision informed by data is paired with context—and never treated as a substitute for human judgment.We meet regularly as a team to review what’s working, what feels off, and how we can improve the signal-to-noise ratio. The goal isn’t surveillance—it’s insight. And insight only matters if it’s mutual and trusted.
Where This Can Go Next
- Correlating Git activity with Jira tickets or issue resolution
- Measuring review culture (PR comments, review latency, etc.)
- Tracking mentorship and collaboration through comment networks
- Adding visualizations and dashboards for time-based trends
Metrics are most powerful when they’re part of an ongoing conversation—not a one-time audit.
If you’re considering implementing a metrics initiative within your organization, I encourage you to bring your development team into the process early. Get them on the bus before it’s moving. Transparency helps build trust, reduce suspicion and improve adoption.
A Practical Jumpstart
To make these ideas more tangible, I’ve included a PowerShell script that analyzes Git activity over the last 24 hours and emails a summary to a team lead. It pulls data like:
Number of commits
Adjusted code impact (lines added/removed)
PRs opened and PRs needing attention
Last commit timestamp for each team member
It’s intentionally lightweight—designed to be portable, cross-platform, and easily extended. You won’t need a database or dashboard to get started, and the configuration lives in a simple settings block.
This isn’t a comprehensive analytics engine. It’s a jumpstart—meant to get your team thinking, measuring, and refining with real data.
As-is, this script is useful for generating a daily summary of development activity. Not a deep dive—but enough to keep your thumb on the pulse of development and spot issues early.
In my own work, I run a more comprehensive script that emails each developer a personalized work summary across all the repositories they touch, and sends me a detailed report broken down by developer and repo but that analysis runs monthly.
For day-to-day awareness, I use a version very similar to the one below—just enough to stay informed without overwhelming myself or my team.
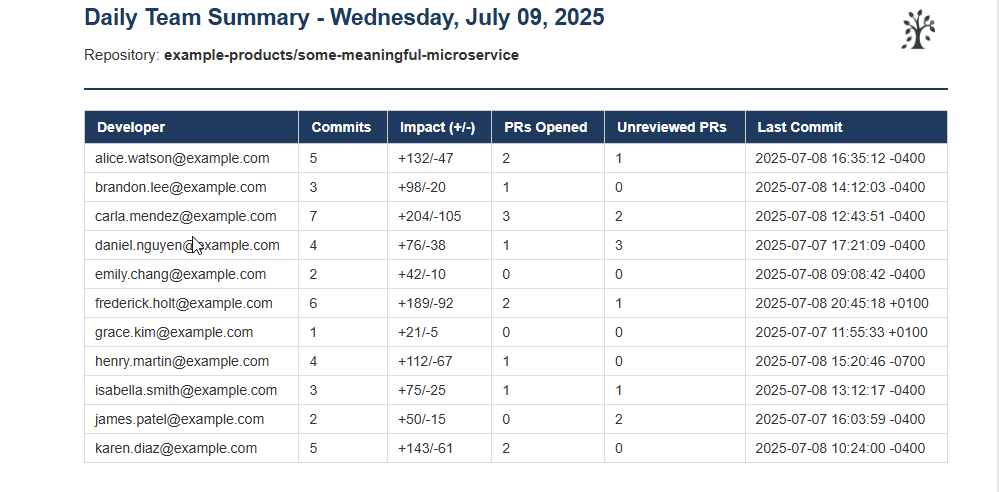
What You’ll Receive
The script sends a styled HTML email to the designated team lead with:
- Commit counts
- Adjusted impact (lines added/removed)
- PRs opened
- PRs assigned but not yet reviewed or commented on
- Last commit timestamp per developer
Closing Thoughts
I hope this article gets you thinking about ways you might measure developer productivity by leveraging the rich data available to us, and I hope that it starts you on a journey of discovering what questions your team needs answers to.
The provided script was meant to be illustrative of the concept, and not a framework itself. Build on it, consider adding caching, robust error handling and logging and support for reading configuration from a file and I think you’ll find you have everything you need to build out your own automated analytics platform.
Above all, talk with your team and share your work!
Best of luck. Reach out if you have questions.


Leave a comment